
Ten Days
A return to Earth. An unexpected liftoff.

Between April 1st and April 10th, four astronauts aboard NASA’s Orion spacecraft traveled farther than any human being in history — 252,756 miles — before splashing down off the coast of San Diego. The mission lasted just under ten days.
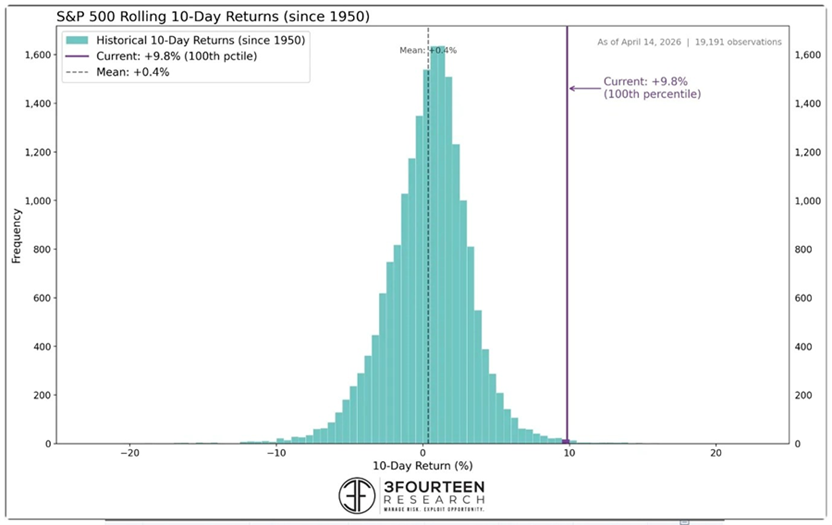
In the ten days ending April 14th, the S&P 500 rose 9.8%. Across nearly 20,000 rolling ten-day periods since 1950, that return ranks in the 100th percentile, joining only twenty other instances.1
Two record-setting journeys. The same two weeks.
One came home. The other is still climbing.
The temptation when markets move fast is to reach for a simple story. Either the worst is over, or we’re being set up for another leg down. The war is winding down, oil is dropping, the economy is turning a corner. Or, the war is dragging on, oil is staying high, not to mention… AI’s going to take all the jobs.
No one knows. And yet, perceived certainty is always available — someone’s selling it.
But moments like the one we just experienced, when deep drawdowns recover quickly, have historically been followed by more uncertainty before more clarity.
The S&P 500’s recent recovery ranks as one of the five quickest on record. But looking back at the other four instances, as well as the twenty times since 1950 when the market has surged as much in ten days, the picture isn’t uniformly bright. Some led to continued rallies. Others, like March 2000 and October 2007, led to further losses.
The weeks and months immediately following the bursts have historically been choppy. Extend the horizon beyond a year, and most returns are positive. But most is most. Not all. The all-clear signal is not guaranteed. It never is.
Here’s what’s worth coming back to, time and again.
Orion splashed down. That’s what it was designed to do: descend, reenter, return. The capsule was never meant to stay up. Its job was always to come home.
Investing is different. Markets do go down, sometimes dramatically, making investors feel like they’ll never recover. But most of the time, markets go up. Then higher. Then higher still. Unlike a spacecraft, they don’t have a designed endpoint.
With over 125 years of S&P 500 history, markets have never permanently splashed down. Following every decline, including the biggest — 1929, 1974, 1987, 2000, 2008, and 2020 — markets resumed their ascent. Not immediately. Not without real pain. Sometimes not without a genuine wound. The financial crisis didn’t just frighten investors; it left many emotionally scarred. But even then, eventually.
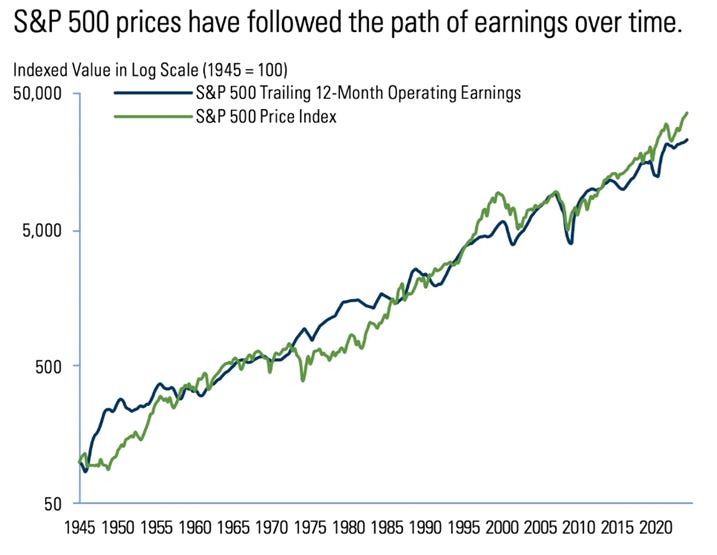
There’s a quietly powerful chart: S&P 500 Index Price plotted against S&P 500 Earnings, going back to 1945.2 Over 80 years, the two lines track each other with remarkable consistency. The message isn’t subtle. Prices follow earnings. And earnings, over time, reflect the productive capacity of human enterprise — businesses solving problems, serving customers, generating value. Periodically it slows. Sometimes it stumbles. Occasionally falls hard.
But it has never stopped for long.
While valuation is a poor predictor of short-term performance, it does tell us something about the cost of what we are buying.
Think of it as the price of admission for the journey ahead. Pay a lot, and good outcomes could have been a bit better. Pay less, and good outcomes can become great ones.
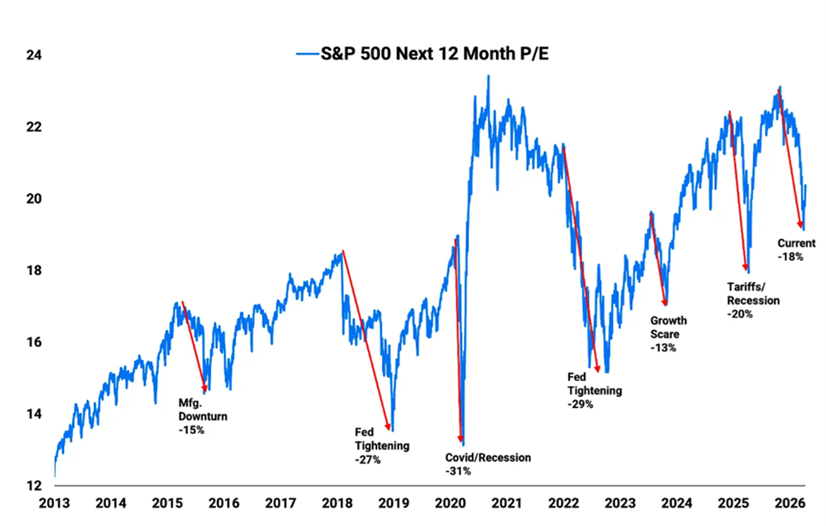
The S&P 500 forward P/E (Price-to-earnings ratio: what investors are paying today for the next twelve months of earnings) dropped roughly 18% during the recent selloff.3 Not because earnings deteriorated. Because the market dropped 10% while earnings estimates actually rose by 8% from the start of the year.
Declines of this magnitude in forward P/E are relatively rare. When they’ve occurred — during Covid, during the Fed’s aggressive tightening cycle in 2022, and during other periods of elevated fear — the compression was each time followed by a sharp rebound.
As is often the case, fear lowered the price even as fundamentals improved. Today, investors are paying more than they were ten days ago, but still less than they were at the start of the year.
All of this isn’t about prediction. It’s simply observing that the market is now less expensive, and that earnings — the single variable prices have followed most closely for over a century — are pointing higher.
The astronauts aboard Orion trained for years for a journey that lasted ten days. They understood, going in, that the mission would take them farther from safety than any human had ever been. They accepted that uncertainty not because they were reckless or naïve, but because they trusted the architecture, the systems, and the process, built on decades of testing and accumulated knowledge. And they trusted the people on the ground at mission control.
Investors who were rewarded over these last ten days didn’t do anything heroic. They didn’t time the bottom. They didn’t read the signals correctly or move decisively at the right moment. They simply stayed. They were invested when the descent happened, and they were still invested when the ascent followed. The architecture held. The process worked.
That’s not luck. That’s the whole idea.
And that idea spans a lifetime.
The investment journey isn’t ten days. Or even ten years. It’s measured in decades. Like the astronauts, investors require sound systems and processes built on time-proven knowledge, along with a trusted ground crew to help navigate the voyage.
No one knows what the near term holds, despite what the confident voices on television suggest. History shows that a well-diversified equity portfolio, combined with thoughtfully structured fixed income, provides a durable foundation for that journey.
But only if you stay invested.
Investors don’t find returns — returns find investors — most often at unexpected times.
Look no further than the last ten days.
Always enjoy reading your views on the market. Absolutely love that you framed this one around the Artemis II mission.
My wife and I are older than most parents with similar age kids. Having kids now age 8 & 11, and seeing how they’re at a similar age to what we were when the Challenger blew up… that Artemis II mission was a more nerve racking than I’d anticipated. When Artemis finally landed, my wife and I both breathed a huge sigh of relief.
As I think about how people see their retirement savings, it is the exact opposite… we’re afraid our nest eggs will fall back down, return to where it started, and there is no landing. There’s rarely a relief and feeling of having landed. Most retirees wonder well into their final years if they have enough, will it last. We covet safety and certainty when, many times, it’s an illusion.
Appreciate how you drew comparisons between those two events. I’m sure I’ll think about that plenty in years to come.
Thank you, James. "Of Money and Meaning" -- the perfect title for your Substack.
You are, and have always been, the steady hand at the tiller, no matter how high the waves go up and down. Whether the subject is money or anything else.